Overview
 Introduction
miR-TV is the abbreviation of "microRNA Target Viewer". It integrated biological experimental data, bioinformatic analysis, data visualization and interactive data manipulation together. Users can get micro- and macro- microRNA information at a glance. First, users can search on miRNA and see the expression of the miRNA in all cancer types (Fig. 1).

Fig. 1
After clicking the cancer type, users can get the overall picture of miRNA expression at a first view (Fig. 2) and get the clinical data of each data point by simply double clicking the boxplot (Fig. 3).

Fig. 2

Fig. 3
Besides, users can screen out the data they want by simply selecting the range of each features (Fig. 4). Users can view all features of at one time (Fig. 5).

Fig. 4

Fig. 5
Finally, users can screen out the miRNA rank, mRNA rank and clinical data they want to generate the histogram or bar chart of each features. Further more, uers can see the survial curve dynamicly (Fig. 6).

Fig. 6
Query miRNA
If Users want to query one miRNA, users should click "QUERY" item in the menu bar in the right upper corner (Fig. 7).

Fig. 7
Next, users can input the name the miRNA that users are interested in, then select the miRNA users want or simply press "enter" key on the keyboard. (Fig. 8).

Fig. 8
The miR-TV will show expression level of this miRNA in all cancer types order by student t-test p-value (Fig. 9).
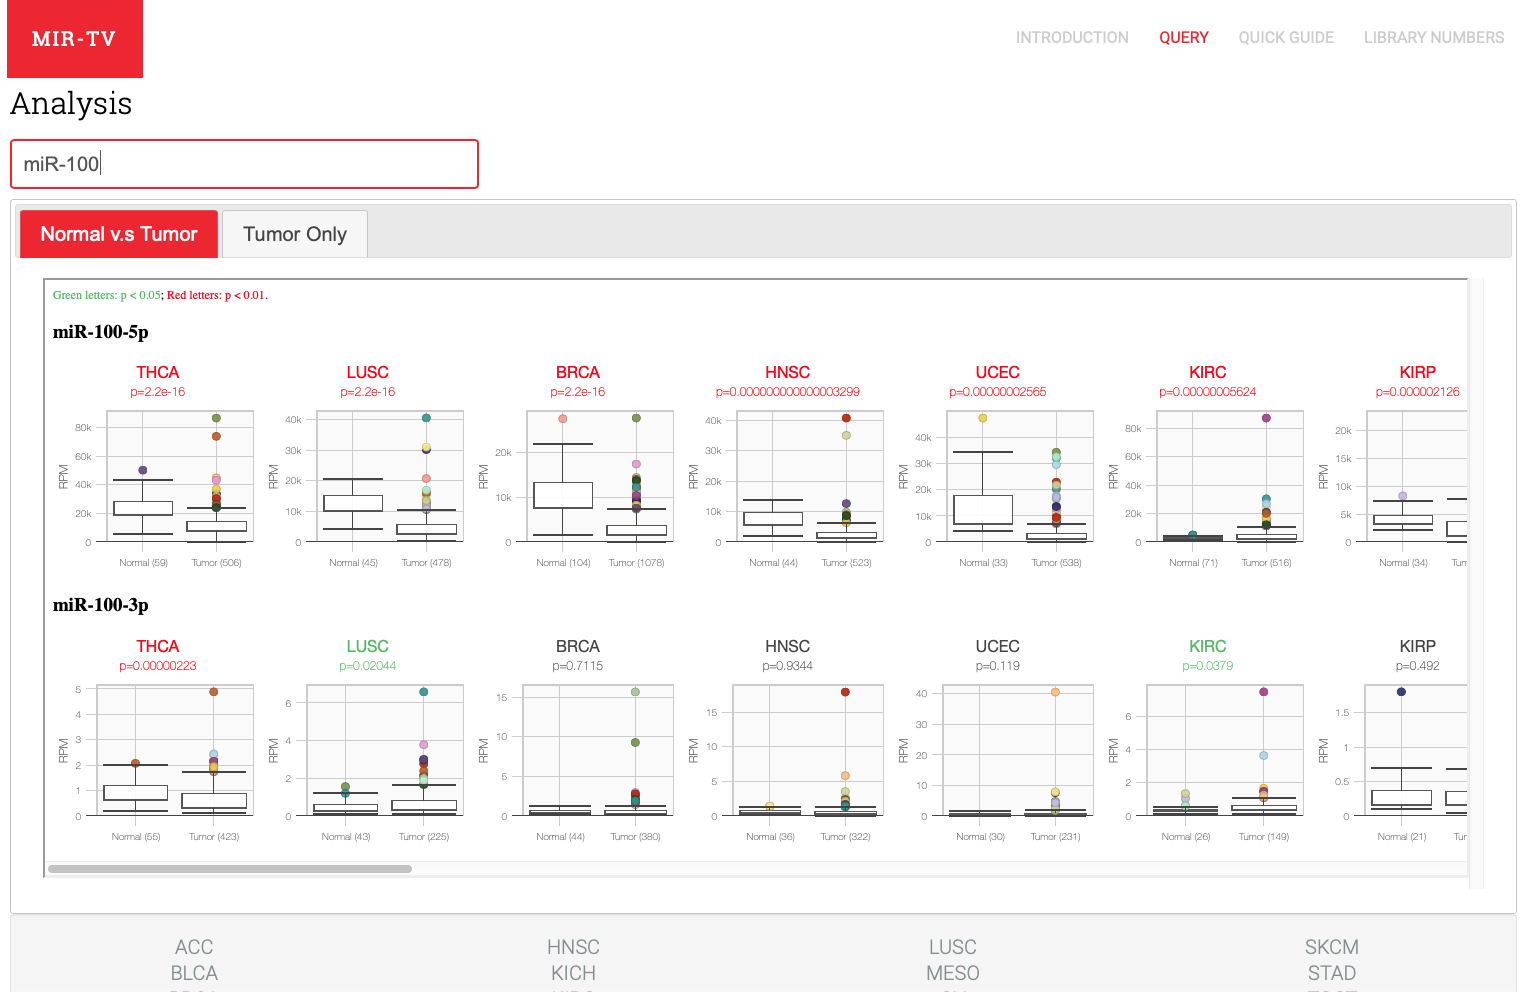
Fig. 9
Next, users can see the detail expression data by simple clicking the cancer type (Fig. 10).
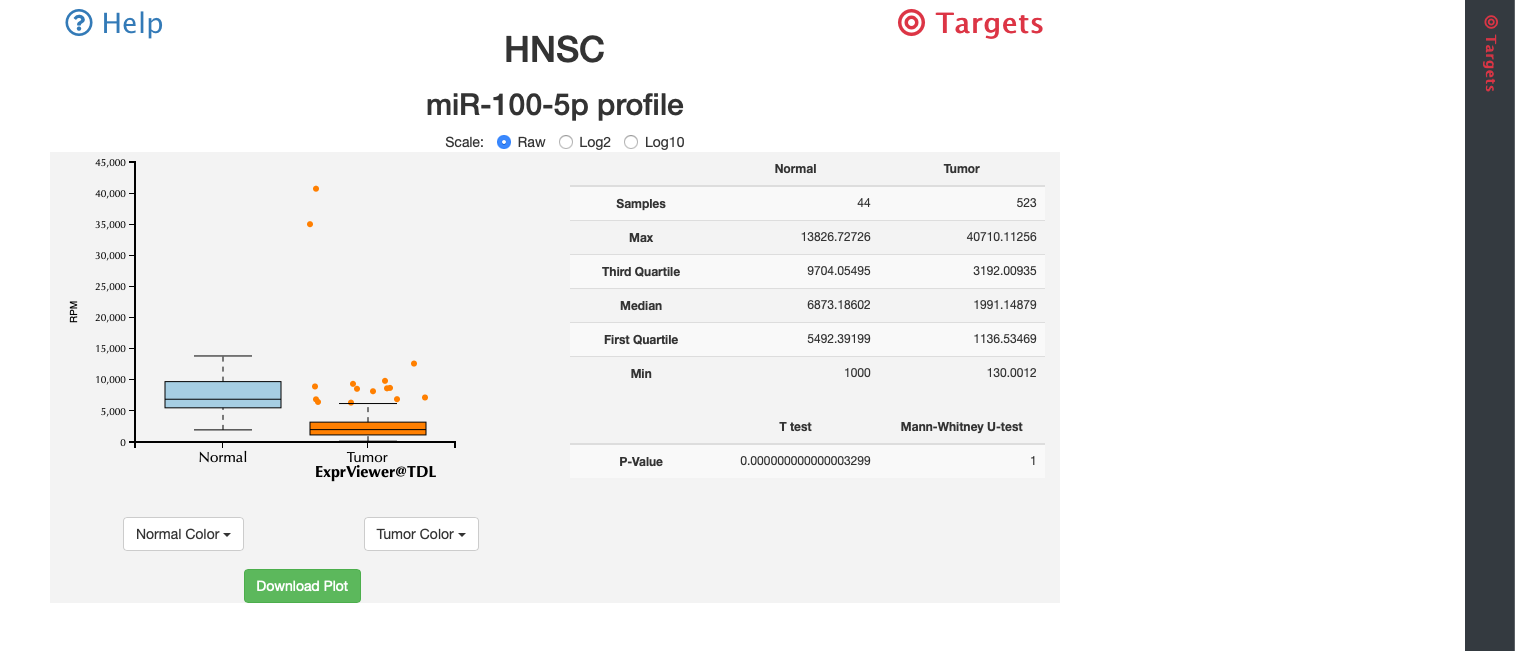
Fig. 10
comparison by tissue or cancer
One miRNA can be differentially expressed in different tissues or cancers (Fig. 11). For example, miR-326 is already known that is differentially expressed in different tissues [Tissue-Specific Expression Patterns of MicroRNA during Acute Graft-versus-Host Disease in the Rat].
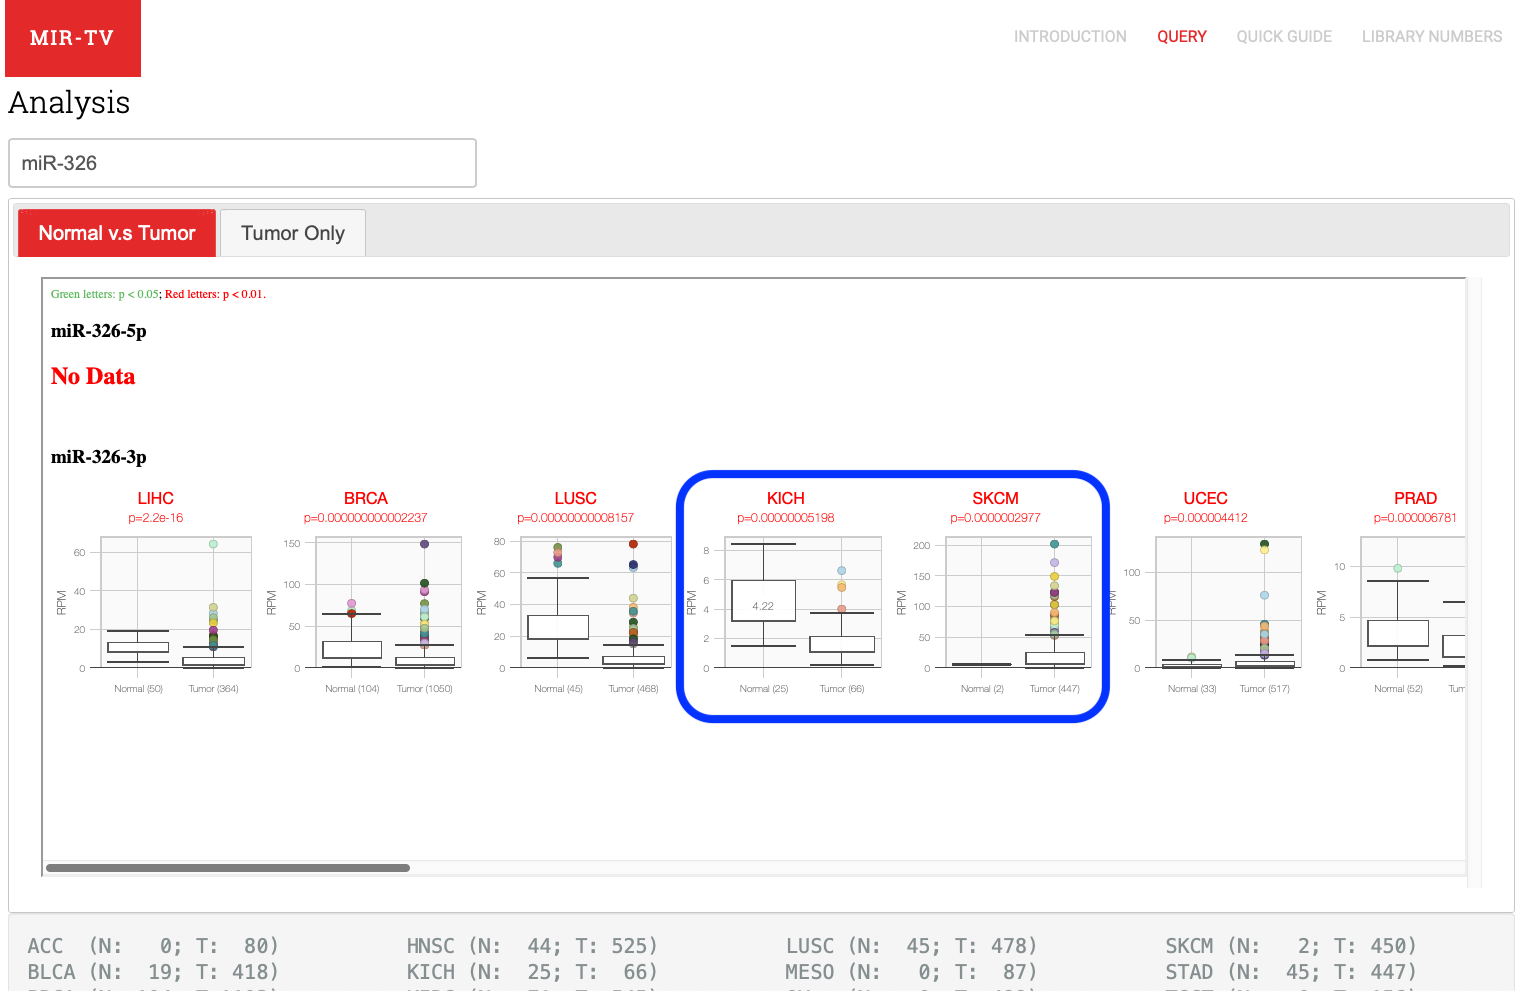
Fig. 11
comparison by arm
One miRNA might switch the arm from which the functional miRNA is processed, such as miR-193a (Fig. 12).[Arm Selection Preference of MicroRNA-193a Varies in Breast Cancer].
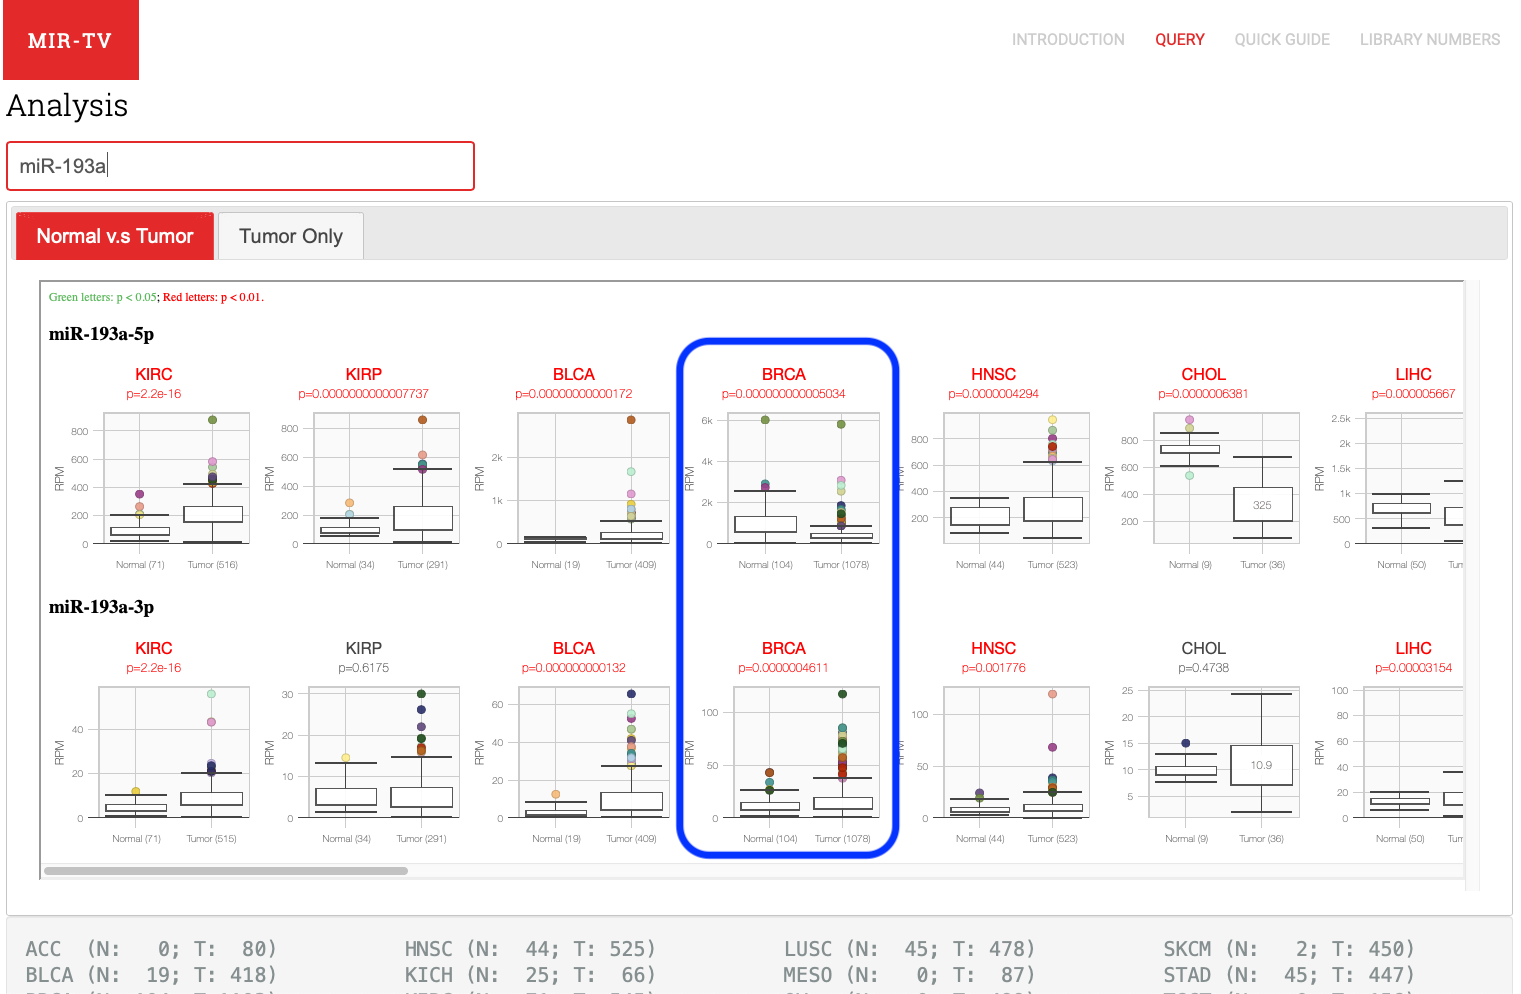
Fig. 12
comparison by tissue or cancer
One miRNA can be differentially expressed in different tissue or cancers (Fig. 11). For example, miR-326 is already known that is differentially expressed in different tissue [Tissue-Specific Expression Patterns of MicroRNA during Acute Graft-versus-Host Disease in the Rat].

Fig. 11
comparison by arm
One miRNA might switch the arm from which the functional miRNA is processed, such as miR-193a (Fig. 12).[Arm Selection Preference of MicroRNA-193a Varies in Breast Cancer].

Fig. 12
Summary of miRNA targets
Users can get the overall picture of miRNA expression at a first view (Fig. 13) and get the clinical data of each data point by simply double clicking the boxplot (Fig. 14).
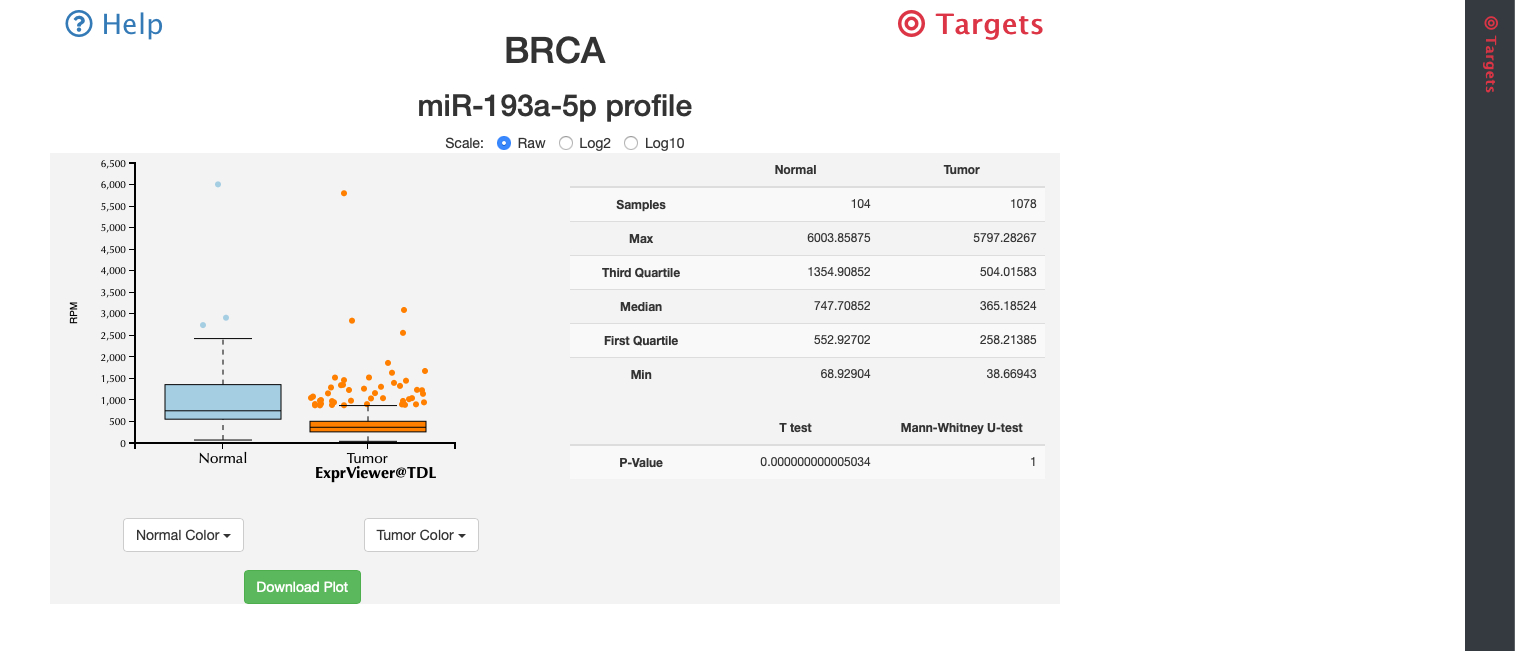
Fig. 13
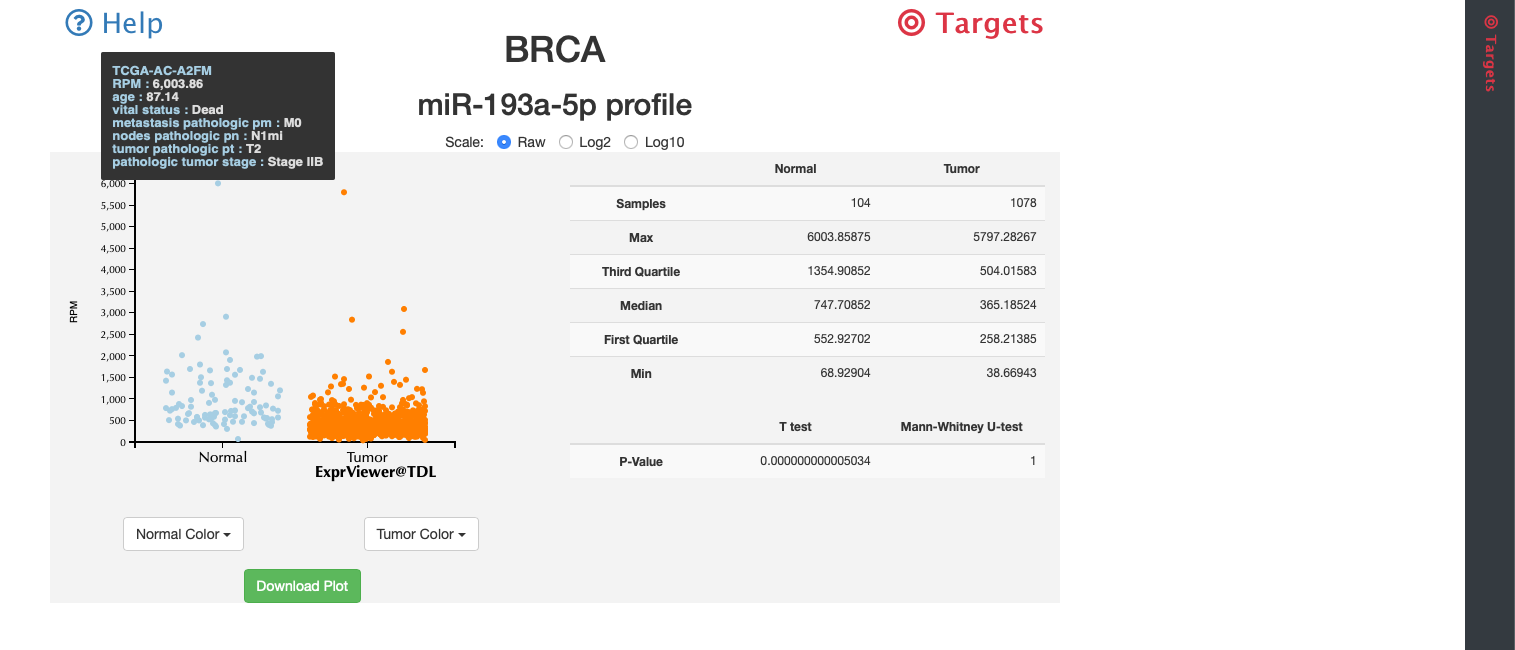
Fig. 14
Screen out by figures
Users can click " Targets" at the top-right to slide miRNA targets information panel in. (Fig. 15).
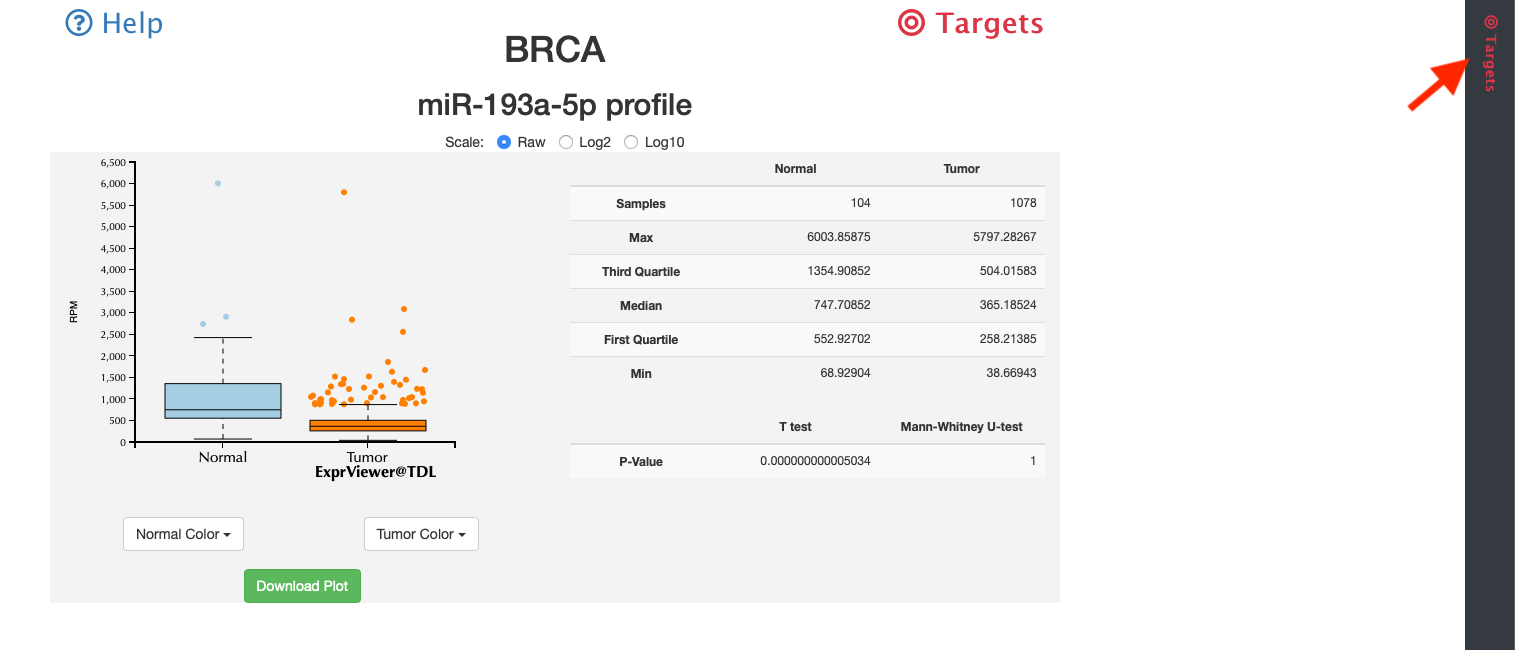
Fig. 15
Users can screen out the data they want by simply selecting the range of each features (Fig. 16).
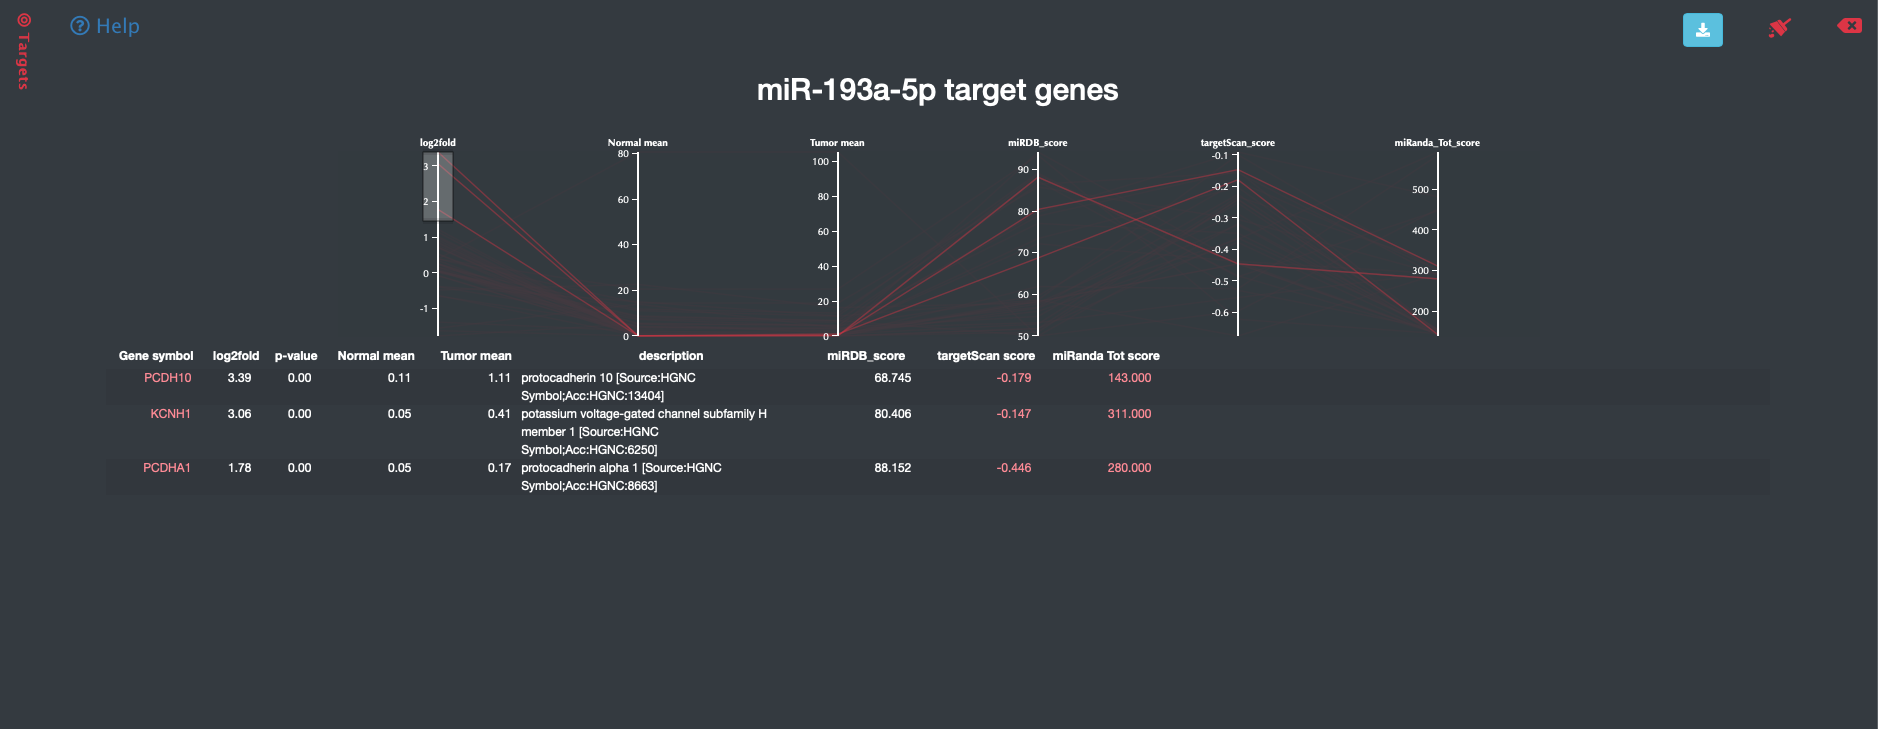
Fig. 16
Select by table
When users mouse over one target gene, users can view all features of at one time (Fig. 17).
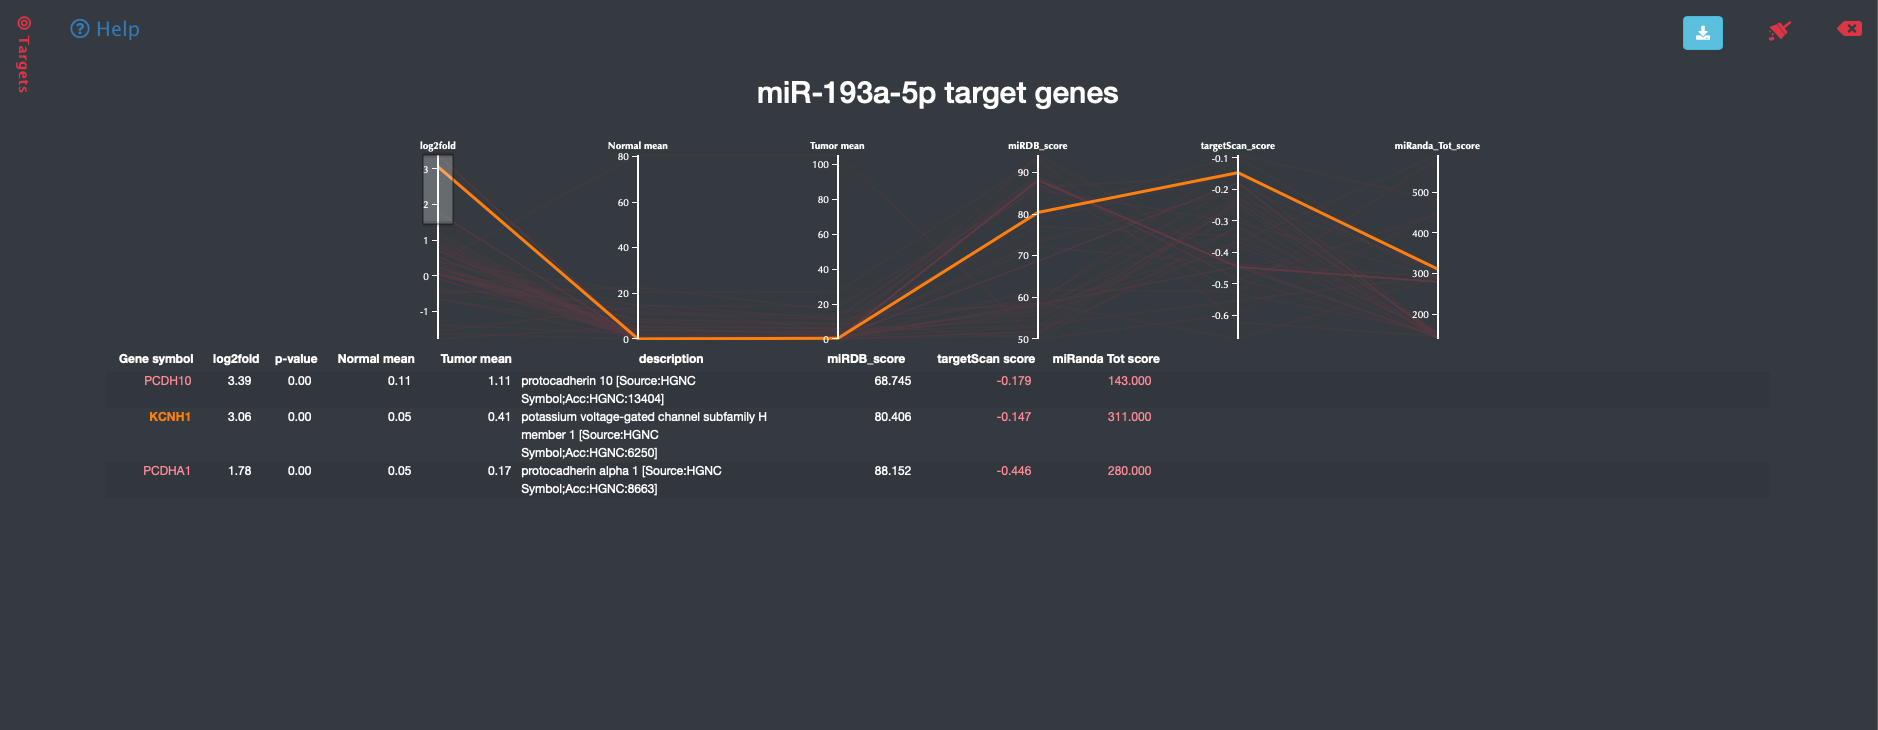
Fig. 17
Screen out by figures
Users can click " Targets" at the top-right to slide miRNA targets information panel in. (Fig. 15).

Fig. 15
Users can screen out the data they want by simply selecting the range of each features (Fig. 16).

Fig. 16
>
Select by table
Users can click "Targets" at the top-right corner to slide miRNA targets information panel in. (Fig. 15).

Fig. 15
When users mouse over one target gene, users can view all features of at one time (Fig. 17).

Fig. 17
Summary of miRNA targets
Users can get the overall picture of predicted target mRNA expression of miRNA at a first view (Fig. 18) and get the clinical data of each data point by simply double clicking the boxplot (Fig. 19).
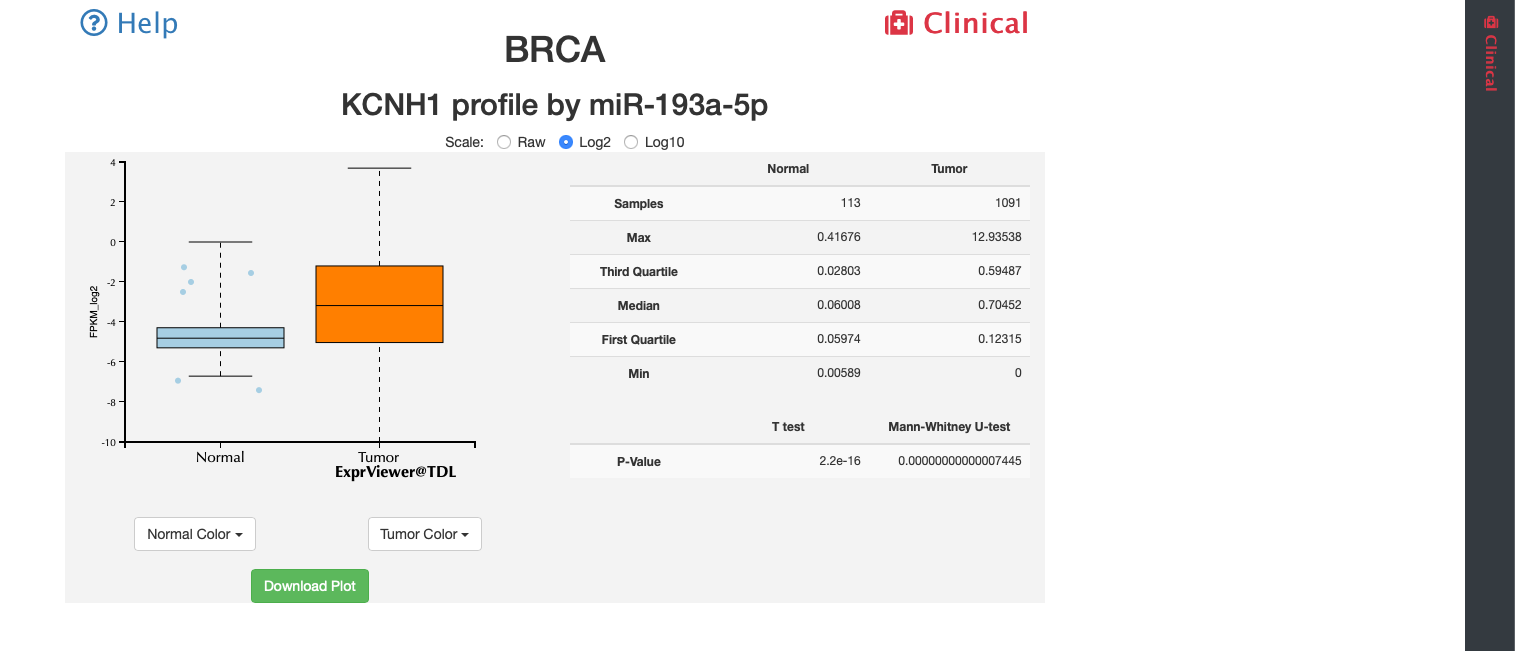
Fig. 18
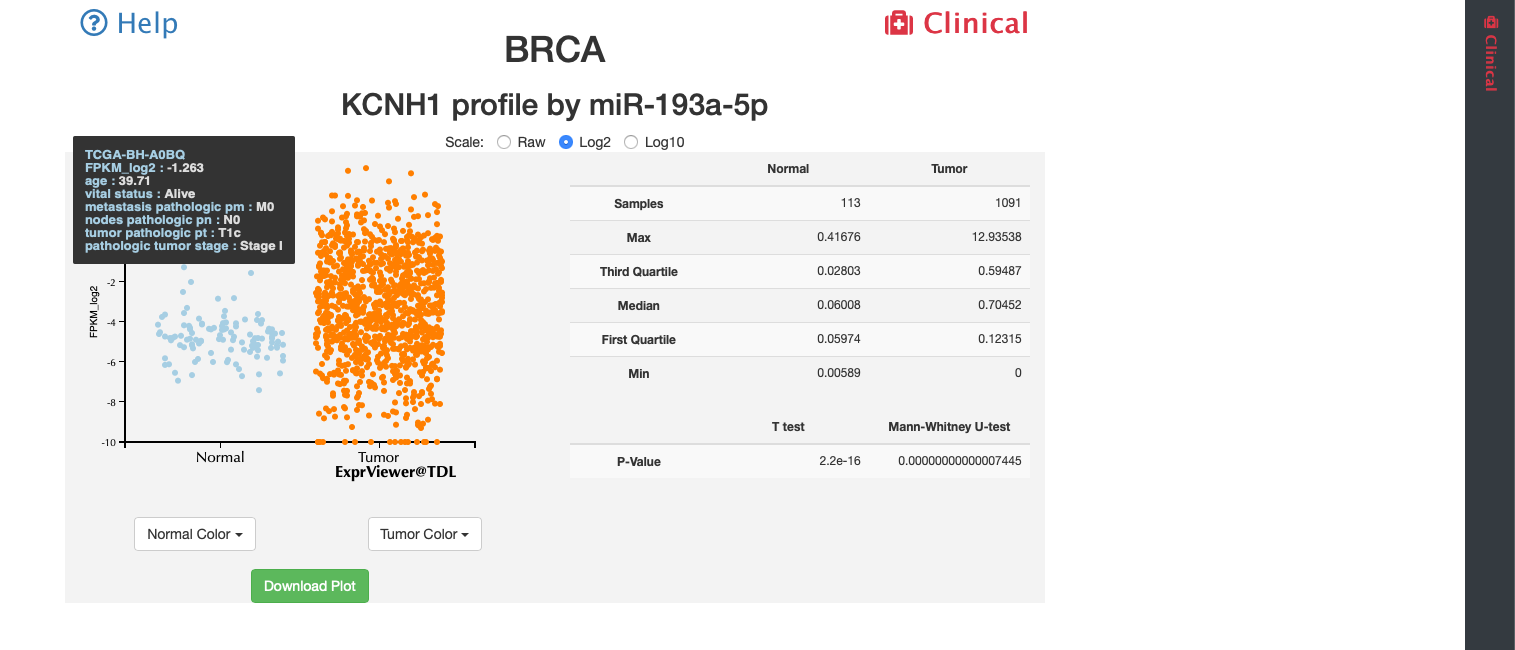
Fig. 19
Clinical data of miRNA targets
Users can click "Clinical" at the top-right to slide clinical information panel in. (Fig. 20).
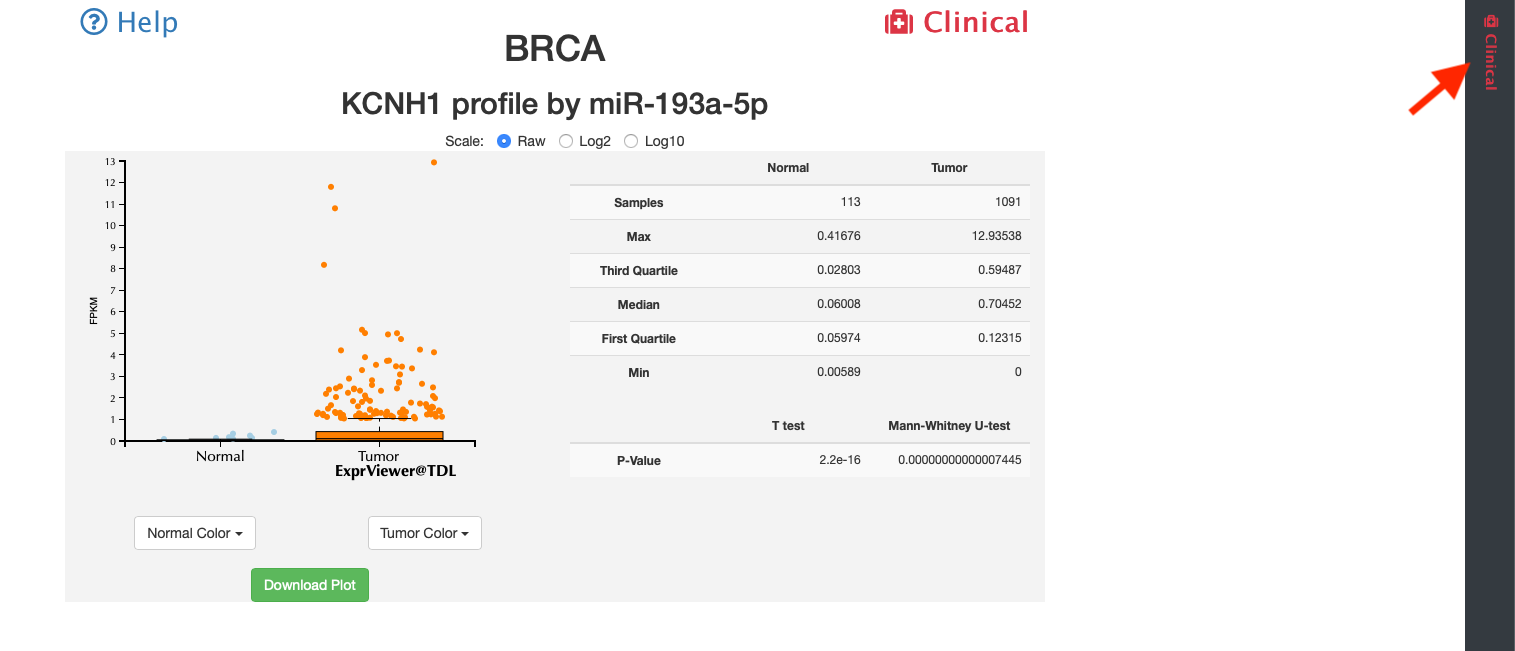
Fig. 20
Users can screen out the data they want by simply selecting the range of each clinical features. miR-TV will show the histogram or bar chart of each features. Further more, users can see the survival curve dynamically (Fig. 21).
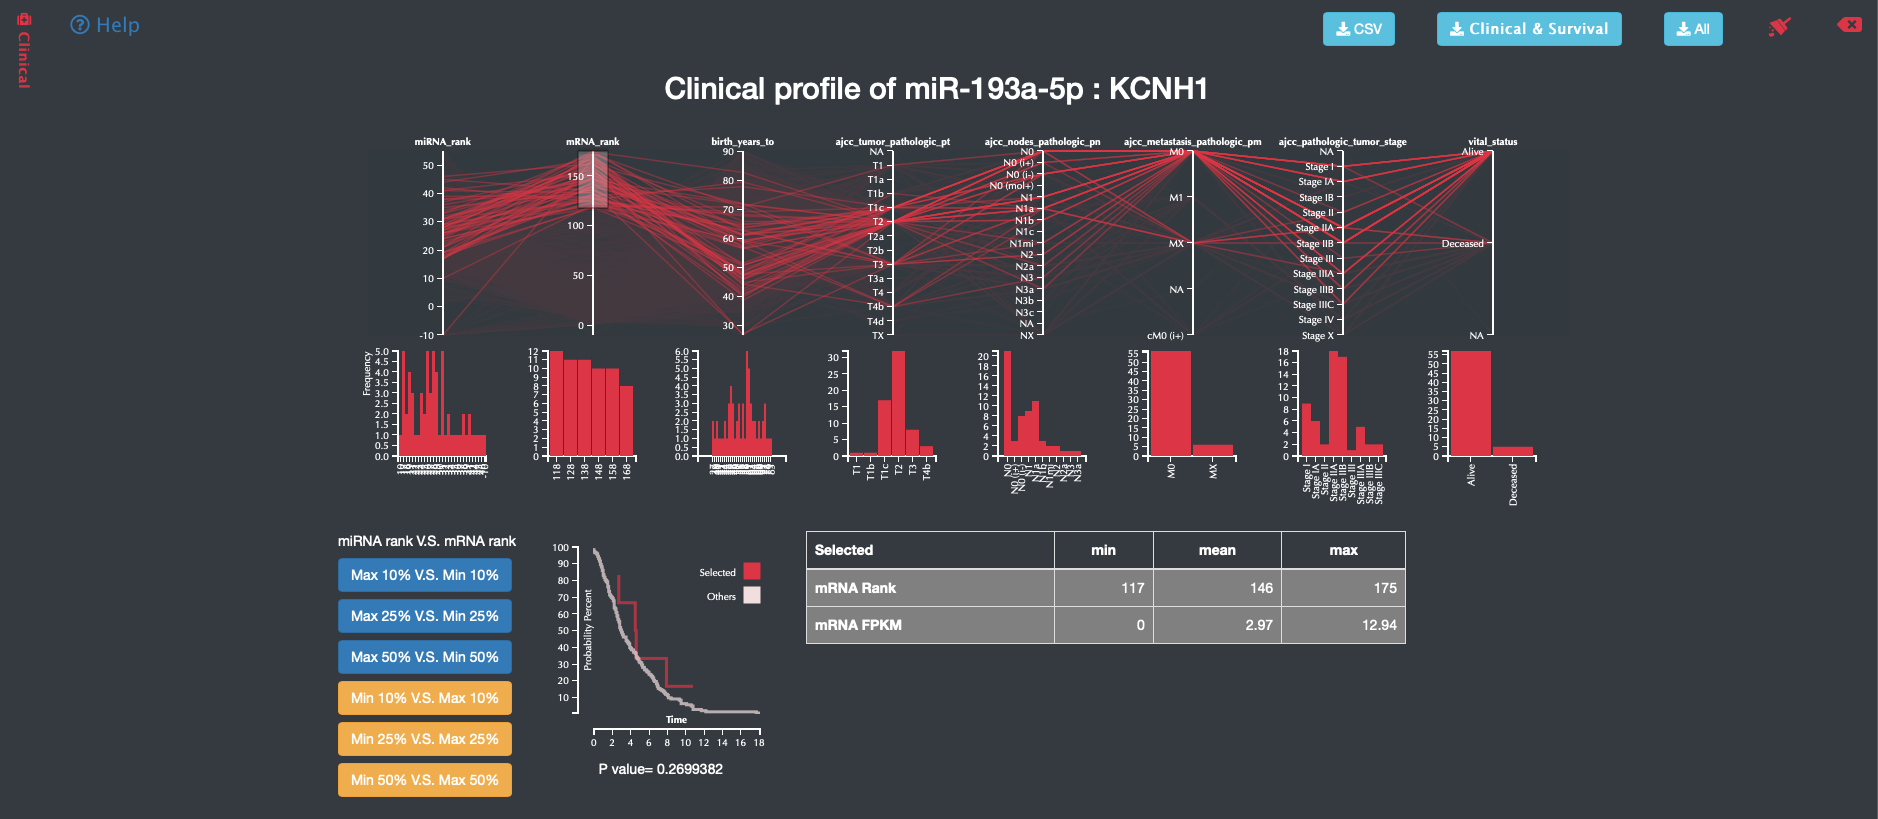
Fig. 21
Download data
Users can click "Download Data" at the bottom-right to download selected data in csv format for further analysis. (Fig. 22).
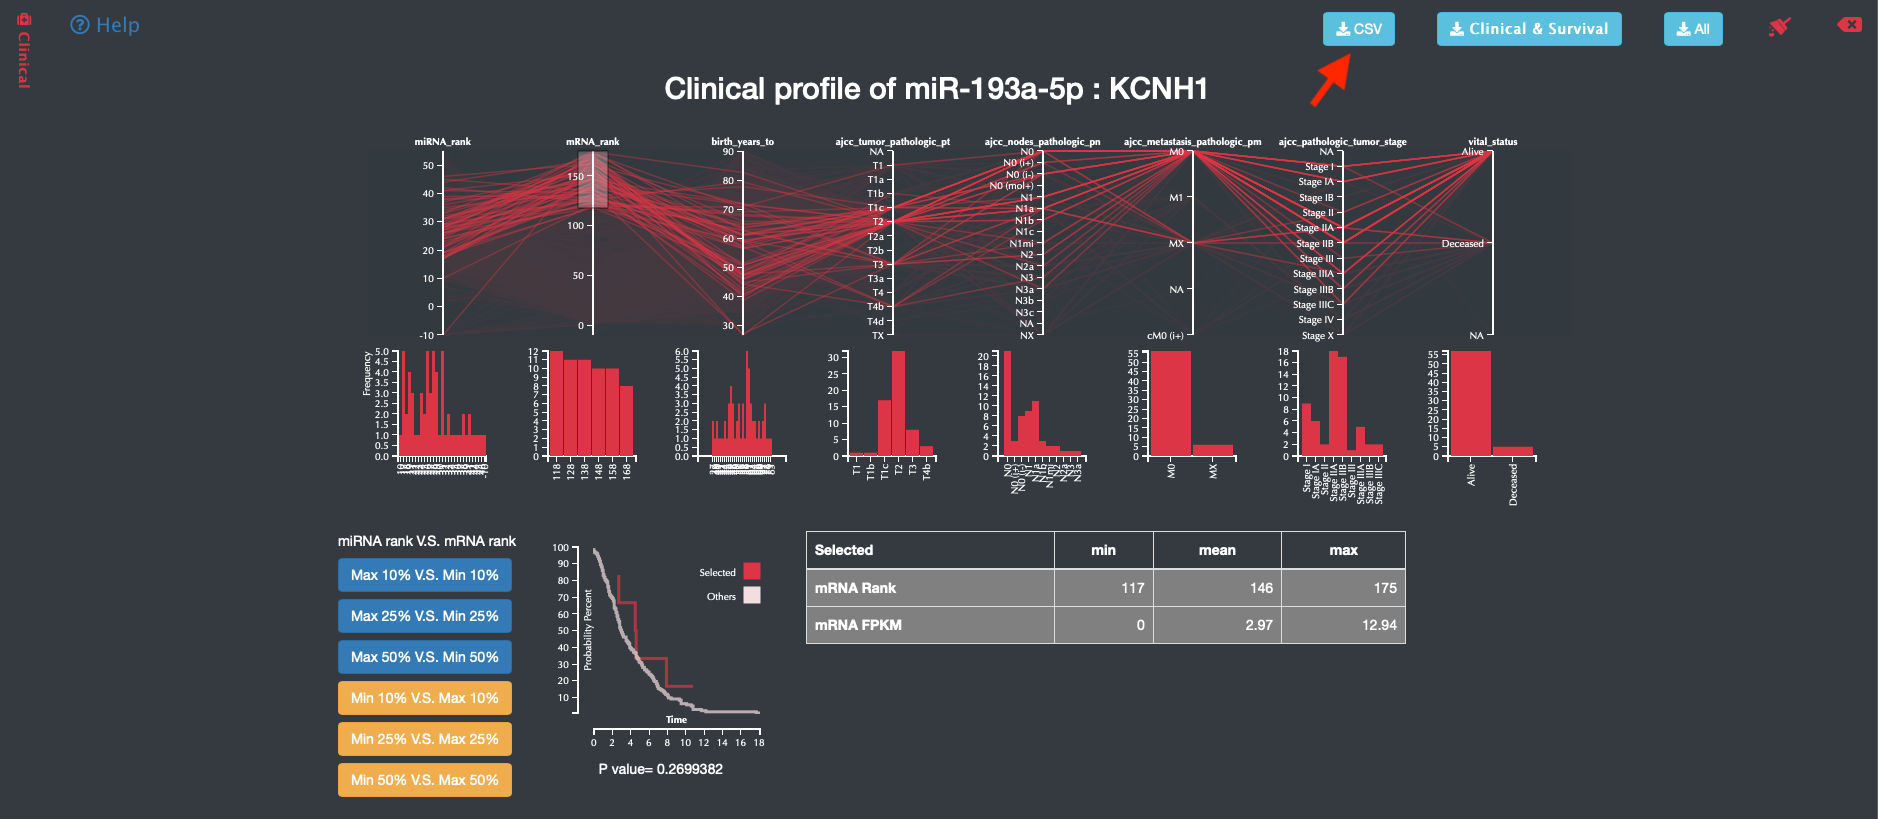
Fig. 22
The downloaded data file is as Fig. 23.
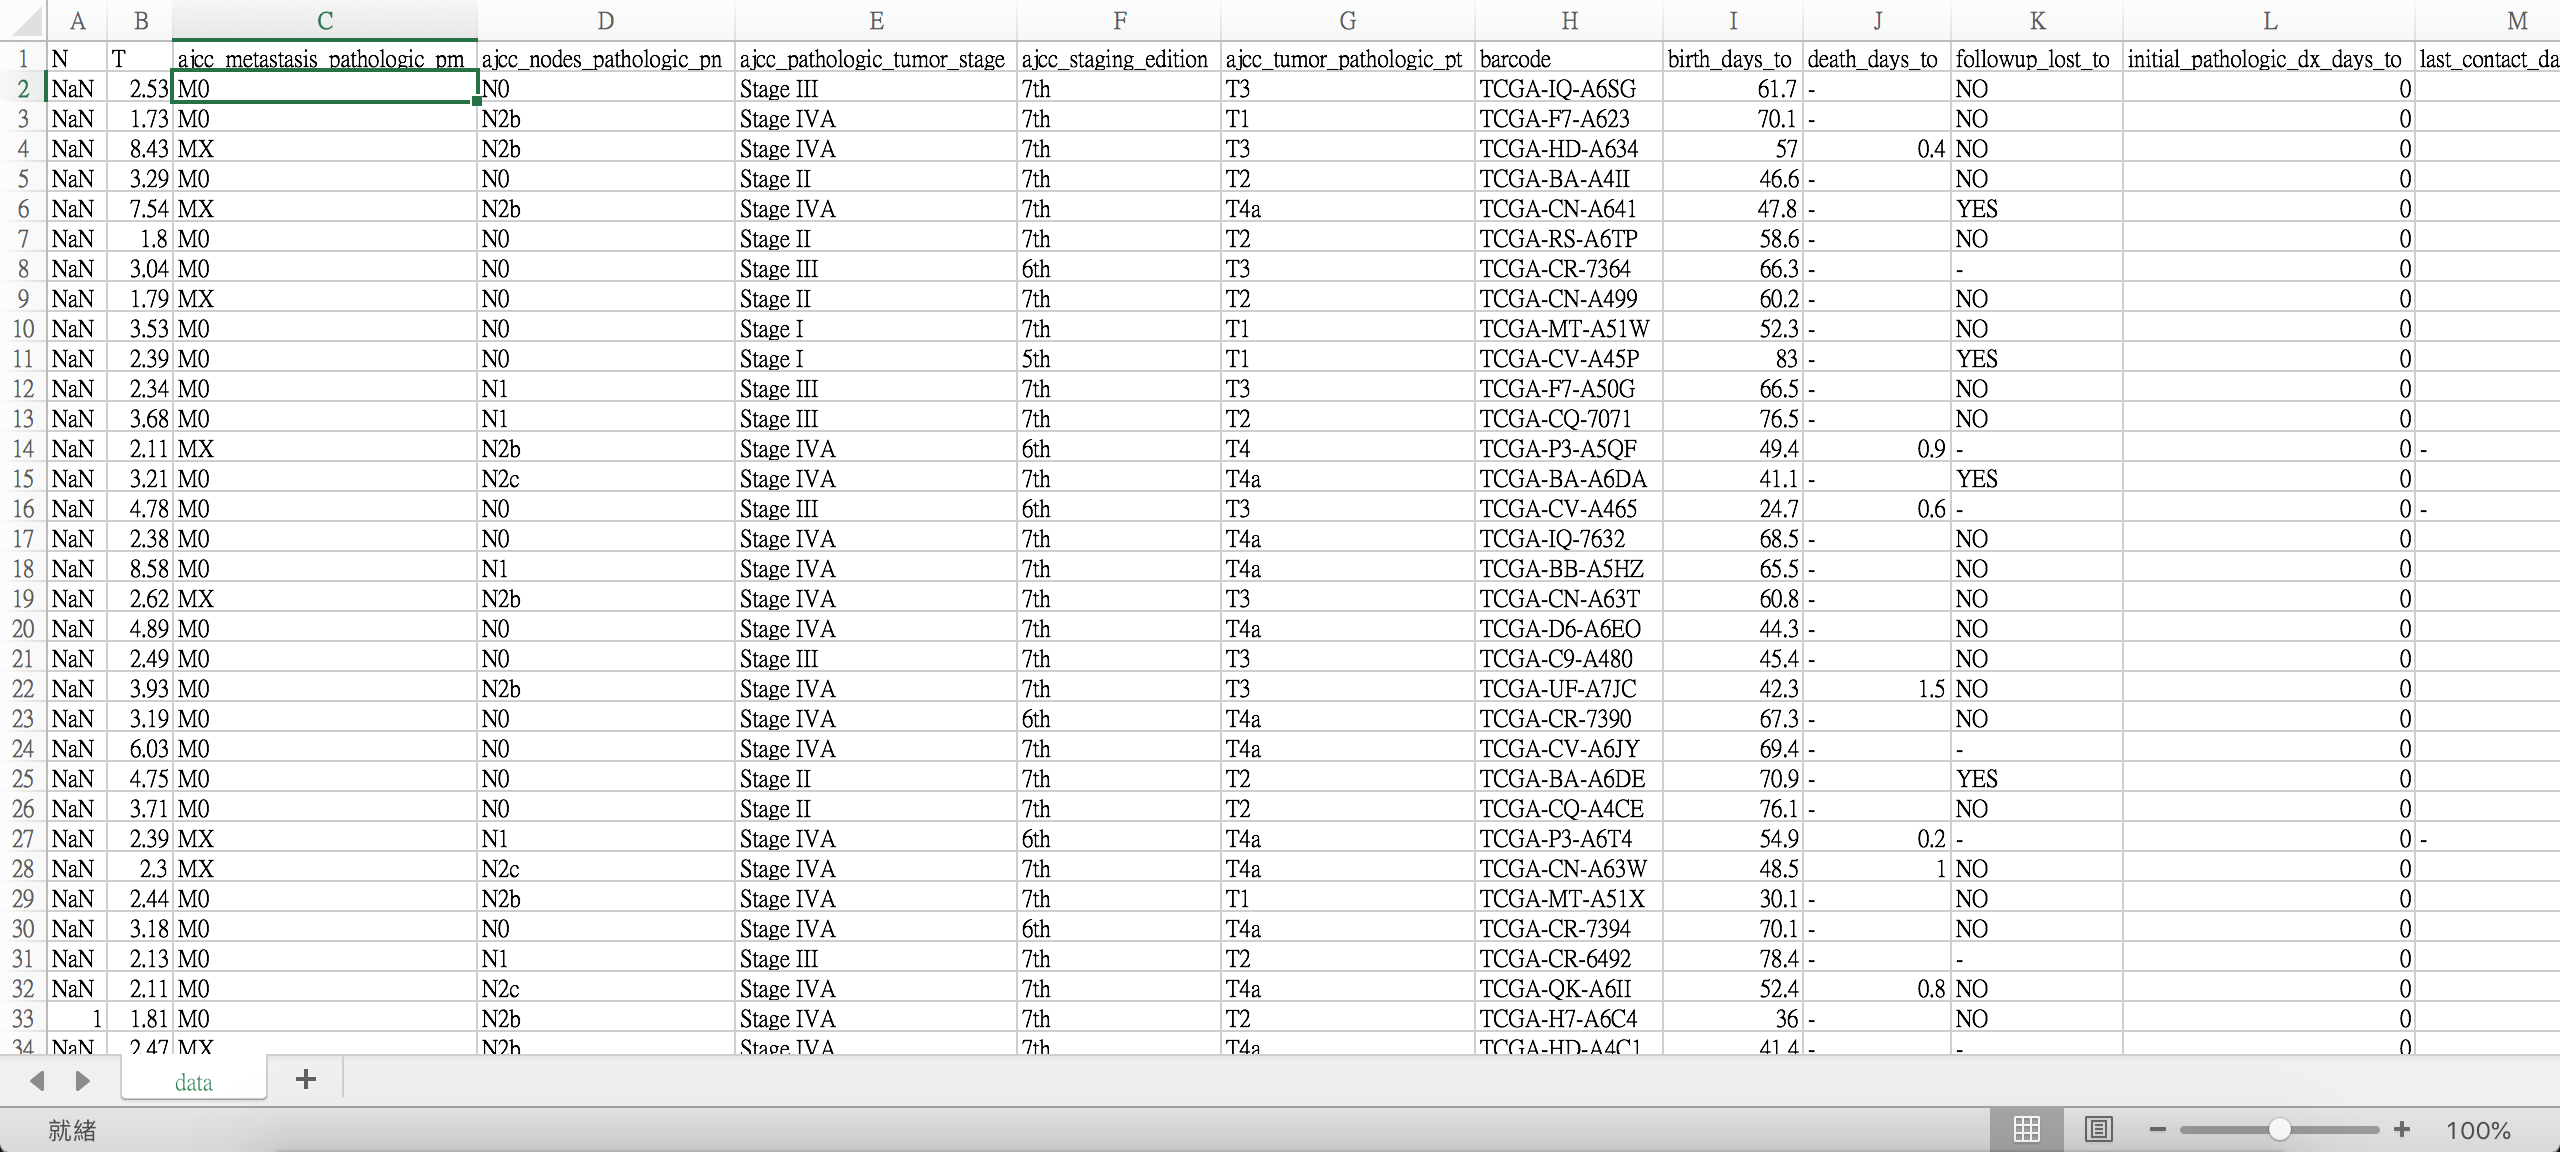
Fig. 23
 Introduction


